Precious metals prices have fallen significantly as rising oil prices signal higher inflation for longer.
The 2026 Iran War is impacting commodities and equities across a broad swath of the global markets. The ever evolving conflict has muted the fundamentals that had produced record high gold, silver and platinum prices earlier this year.
As these metals are often priced in US dollars, a strong dollar on higher oil prices has placed a “war premium” on the cost of purchasing these metals for international buyers. In addition, the potential for the US Federal Reserve to begin cutting interest rate cuts later this year has completely evaporated under the looming threat of higher inflation to come as surging oil prices cause a ripple effect of rising costs across many sectors of the economy.
Let’s take a look at what’s got the precious metals moving over the past week.
Gold price
The gold price has lost more than 7.1 percent over the past seven day period and is down almost 19 percent from the record high of US$5,589.38 per ounce it reached on January 28.
The yellow metal has lost ground to the US dollar, which as the main currency for oil trade is benefiting greatly from higher oil prices. A stronger US dollar makes gold more expensive for global buyers.
Last week’s US Federal Reserve rate decision also slammed a door on another near-term rally in the gold price. Gold investors had previously expected the Fed would start easing rates soon.
However, none of this signals an end to the bull market cycle in gold.
“From a deeper perspective, the recent sharp decline in gold was not a reflection of weakened fundamentals, but rather the result of acute liquidity pressures across global markets. Gold, by its nature, is often used as a source of funding during times of stress, which explains the heavy selling seen recently,” explained Simon Massabni, head of business development, at XS.com, in market commentary shared with the Investing News Network (INN).
“Investors were not abandoning gold as a hedge, but rather seeking immediate liquidity amid sharp volatility in oil markets and rising yields. This distinction is crucial, as it suggests that gold’s long-term fundamentals remain intact, and that the decline was more of a technical liquidation than a structural shift.”
On March 19, gold hit an intraday low of US$4,50.03 in morning trade, but gained more than US$150 to close at US$4,652.04. However, it lost that ground the next day, falling to an intraday low of US$4,487.61 and closing barely back up to the US$4,500 level as investors continued liquidating gold holdings to make up for equities losses.
On Monday (March 23), gold sank to its lowest mark this past week by falling to US$4,100 in the morning, contributing to its steepest weekly decline in 40 years. Iran’s attacks in the Strait of Hormuz effectively blocked global oil trade in the region. However, the price of gold did manage to settle the trading day at US$4,406.83.
The gold price traded sideways in the US$4,350 to US$4,450 range for much of the following day as investors were locked in a wait-and-see approach after US President Trump said talks with Iranian leaders over a possible end to the war were going well. However, on Wednesday (March 25), gold was back up firmly above the US$4,500 level as ongoing peace negotiations reportedly continued to progress — although Iran has denied the talks are even taking place.
The US has said it proposed a 15 point peace plan and a potential one month ceasefire to Iran, which the Middle Eastern country’s leaders quickly rejected.
As of 1:00 p.m. PST on Wednesday, gold was trading at US$4,535.49
Gold price chart, March 18, 2026 to March 25, 2026.
Chart via the Investing News Network.
Here are the primary drivers for gold this past week:
- Geopolitical conflict in the Middle East, with Iran effectively blocking the Strait of Hormuz, has created high levels of volatility in the global oil markets. Any signs of the Iran war coming to an end are giving the gold price a reprieve from downward pressure.
- Oil prices have come down about 5 percent since last week, easing some of the pressure on the threat of inflation. However, the dollar and 10 year treasury yields remain strong, elevating the opportunity cost for holding non-yielding assets like gold.
- Hawkish signals from the Fed and a higher probability of a rate hike this year are placing a ceiling on any upside in the gold price.
For more insight into what’s moving the gold market, check out INN’s recent interview with Arlen Hansen.
In gold-mining news, Liberty Gold (TSX:LGD,OTCQX:LGDTF) has moved a step closer to advancing its flagship US asset after securing entry into the US Federal Permitting Improvement Steering Council’s FAST-41 program.
Silver price
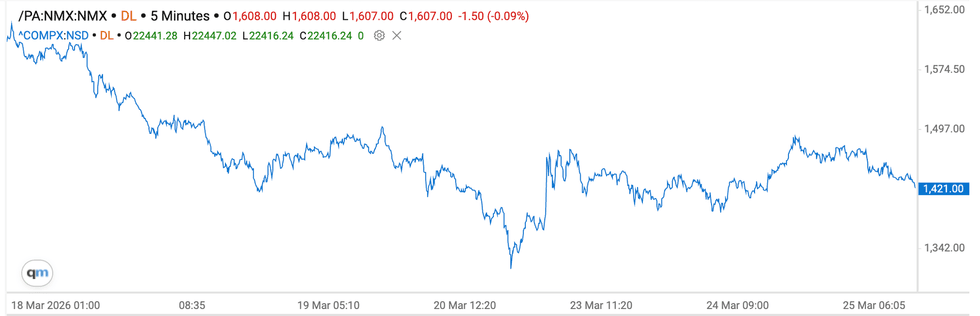
The price of silver is also feeling the weight of the war in the Middle East, with losses at 5.7 percent over the past seven days, and down more than 40 percent from its all-time high of US$121.62, which it set on January 29, 2026. The precious metal’s price this week has shown some resilience with a modest recovery after sharp declines.
After hitting a low of US$67.06 per ounce the morning of March 19, silver took the high road to close at US$72.81. On March 20, the white metal had retreated back to US$67.86 in the morning and barely managed a close at around the US$68 level. Escalations in the Iran war fueled safe-haven demand for the U.S. dollar, and Fed rates in a holding pattern hampered safe-haven demand for precious metals, both of which weighed down silver.
On Monday, silver slid further to reach an intraday low of US$63.37 in early morning trading before rising to close at US$69.12. The following day, the white metal managed to finish the day at an intraday high of US$71.2.
Wednesday was a choppy trading day for silver, which moved up and down in a range of US$71 to US$73.
Silver price chart, March 18, 2026 to March 25, 2026.
Chart via the Investing News Network.
The silver price is finding a floor of support due to a persistent structural supply deficit and strong industrial demand. The world’s most electrically and thermally conductive metal, silver is integral in a number of growth sectors such as solar panels, electric vehicles and artificial intelligence technology.
“This shift in monetary expectations places direct pressure on silver, as it is a non-yielding asset. In such an environment, investors tend to favor income-generating assets like bonds or even the dollar itself over precious metals,” Rania Gule, senior market analyst at XS.com, told INN. “As a result, I see silver currently caught between two opposing forces: theoretical support from geopolitical tensions and tangible pressure from tight monetary policy.”
Want more information about today’s silver market? Check out INN’s interviews: Ted Butler: Silver Blow-Off Top Years Away, How to Play Volatility and Alex Ebkarian: Gold, Silver 2026 Price Calls, Key Drivers to Watch Now.
In silver mining news, Silver X Mining (TSXV:AGX,OTCQB:AGXPF) has closed a US$50.4 million financing to fund expansion at its flagship project in Peru.
Platinum price
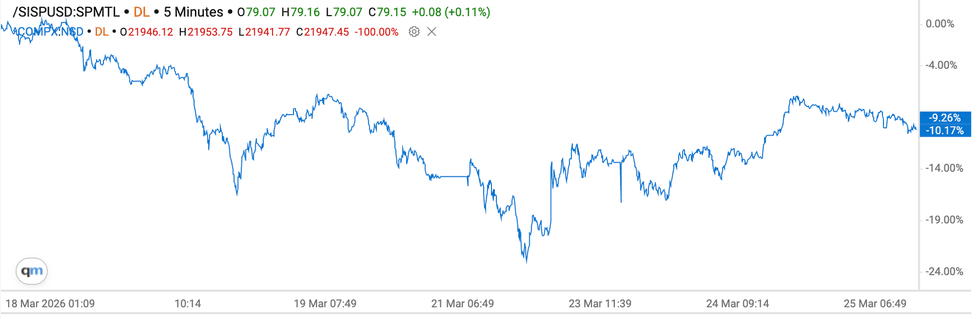
Platinum has held up fairly well these past seven days compared to gold and palladium, with the price down by about 5.5 percent. Investors are increasingly turning to platinum as a safe-haven asset alongside gold.
The platinum price was trading at a low of US$1,858.90 per ounce on March 19, before recovering to US$1,968.90 by closing. On March 20, the price of the precious metal climbed to an intraday high of US$1,996.80 in morning trade before falling back to close at US$1,921. Starting the new week, platinum took a beating on Monday, falling to a weekly low of US$1,1791.80 in the early morning trading session. However, the metal rebounded quickly to an intraday high of US$1,926.90 and later closed at US$1,894.80. As a metal heavily used in the automotive sector, platinum faced pressure from investor fears of an industrial slowdown and stagflation risks.
The following day brought more volatility for platinum as it fell as low as US$1,876 in the morning trading session before closing up at US$1,940.70. Investors are “buying the dip” on the belief that platinum is historically undervalued relative to gold, especially since supply deficit concerns remain. On Wednesday, the platinum price had risen as high as US$1,988 in early morning trade, but sank to US$1,941 by 1:00 p.m. PST.
Platinum price chart, March 18, 2026 to March 25, 2026.
Chart via the Investing News Network.
Platinum continues to outperform its sister metals due to its specific industrial and supply-side drivers.
Production remains tight as aging mines and power instability continue to plague South Africa’s platinum-mining sector, which accounts for more than 70 percent of global supply.
Depleted aboveground stocks are providing a floor that prevents deep price collapses. The World Platinum Investment Council (WPIC) is forecasting a fourth consecutive annual deficit for 2026 at a projected 240,000 ounces.
On the demand side, automakers continue to use platinum in catalytic converters, anchoring long-term industrial demand. The WPIC is reporting that platinum exchange-traded fund holdings, which increased by 234,000 ounces in 2025, are expected to remain at steady levels in 2026. Additionally, bar and coin investment is forecast to grow by 35 percent in 2026 to reach 725,000 ounces, the highest level recorded in the WPIC’s dataset history.
For more on the supply and demand fundamentals shaping the precious metals market: Edward Sterck: Platinum Records Biggest Deficit Ever in 2025, What’s Next?
Palladium price
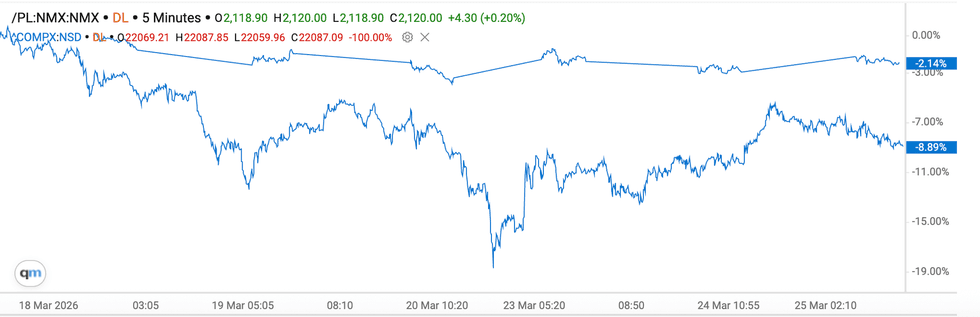
Palladium is down by more than 10 percent over the past seven days, tracking its sister metals lower.
On March 19, palladium hit an intraday low of US$1,412.50 per ounce in the morning, but later peaked at US$1,1472 before finishing the day at US$1,466. Palladium lost further ground on March 20, starting the morning session trading at around US$1,452, later falling to as low as US$1,401. It managed to close the trading day at US$1,417.50.
On Monday, palladium recovered to US$1,475.50 in the morning and went on to close at US$1,439. The following day was another choppy day of trade with palladium dipping below the US$1,400 level to as low as US$1,385 in the morning session. However, the metal mustered up another close of US$1,439.
The price of palladium was trading as low as US$1,425 as of 1:00 p.m. PST on Wednesday.
Palladium price chart, March 18, 2026 to March 25, 2026.
Chart via the Investing News Network.
The palladium price is at its lowest point in a month as investors take profits from the previous rally.
There are signs of contracting demand from the automotive sector and growing supply from higher recycling and steady mine production, reports Trading Economics. Investors are also closely watching for the outcome of the US Department of Commerce investigation into Russian palladium dumping. A final decision is likely in mid-2026, with preliminary findings suggesting a potential 133 percent dumping margin.
Don’t forget to follow us @INN_Resource for real-time updates!
Securities Disclosure: I, Melissa Pistilli, hold no direct investment interest in any company mentioned in this article.
Editorial Disclosure: The Investing News Network does not guarantee the accuracy or thoroughness of the information reported in the interviews it conducts. The opinions expressed in these interviews do not reflect the opinions of the Investing News Network and do not constitute investment advice. All readers are encouraged to perform their own due diligence.
From Your Site Articles
Related Articles Around the Web